NIR Calibration Troubleshooting Checklist: 10 Problems and How to Fix Them
Fix NIR calibration problems fast with this 10-step checklist. Covers instrument drift, sample prep, reference lab errors, and when to recalibrate.
· 9 min read · Vitaly Kirkpatrick
Why NIR Calibration Problems Happen
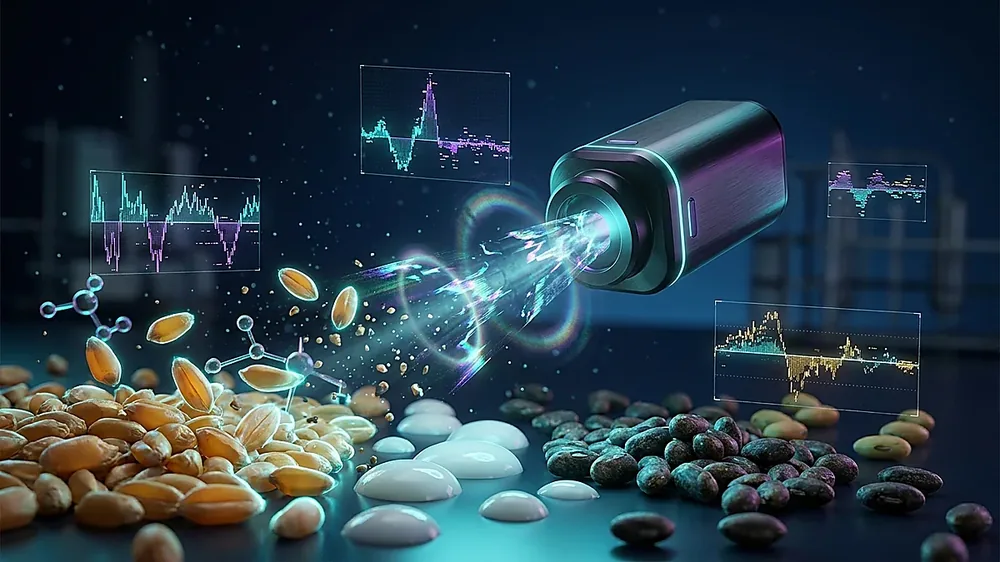
When NIR calibration results drift or predictions become unreliable, most labs assume the calibration model is broken. In practice, that is rarely the first place to look. NIR calibration failures in food and feed operations most often trace back to instrument drift, inconsistent sample preparation, or reference lab errors — not a flawed model. This checklist walks through 10 diagnostic steps in order of likelihood. Work through them before spending time or money on recalibration. For background on how calibration models are built and validated, see our guide to NIR Calibration: Why It's Essential and How It Works.
1. Run Instrument Diagnostics and Standardization Checks
Start here. Run your instrument's built-in diagnostic tests and standardization checks. These tests compare current performance against historical baselines. They can flag instrument drift or hardware faults immediately.
If the instrument fails these checks, stop. The calibration model is not the issue — the instrument needs attention first. Skipping this step wastes time chasing model problems that don't exist.
2. Check Lamp Age and Maintenance Records
Lamp-based NIR systems degrade over time. As bulbs age, spectral output shifts. That shift introduces bias into predictions — even if the calibration model is perfectly valid.
Check your maintenance logs. When was the lamp last replaced? If it is near end-of-life, or if it was recently replaced without a recalibration check, treat it as a prime suspect. Replacing a lamp without bias correction is a common source of persistent calibration error that labs often miss for weeks.
3. Run Trusted Check Samples Multiple Times
Use a stored reference sample with known, verified values. Run it at least three times and average the results.
- Consistent bias across all runs points to an instrument offset or calibration drift.
- Erratic scatter between runs suggests sample prep problems or contamination.
This step separates random noise from systematic error. It is one of the fastest ways to narrow down the root cause before digging deeper into the model or the instrument.
4. Compare Sample Preparation to Calibration Protocols
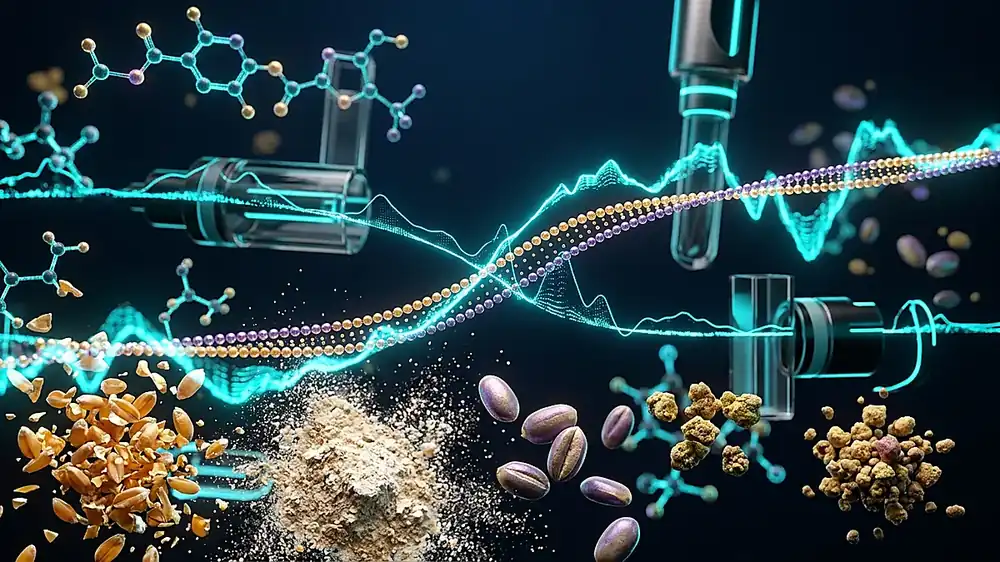
Every calibration is built on samples prepared under specific conditions: particle size, moisture level, temperature, packing density, and how the sample is presented to the instrument. When current sample prep drifts away from those conditions, the NIR instrument reads accurately — but on a different sample matrix than the model expects.
Common deviations include:
- Operators filling cups to different depths
- Sample temperature varying between shifts
- Grinding settings drifting over time
- Different operators packing samples with different force
Confirm that all operators follow the documented preparation methods exactly. Our article on sample preparation for grain and feed NIR covers the specific steps that matter most for common matrix types.
5. Monitor Sample Temperature Closely
Sample temperature is one of the most underestimated sources of NIR prediction error. A 20°C difference in sample temperature can shift moisture predictions by several tenths of a percent or more. For high-value raw materials, that margin matters.
Track sample temperature over several days. If it varies widely — for example, between cold morning deliveries and afternoon production runs — consider conditioning samples to a standard temperature before analysis. Alternatively, update your calibration to explicitly include temperature variation in the sample set. For a deeper look at this effect, see why sample temperature affects NIR results and how to control it.
6. Cross-Check with Reference Lab Data
Compare your NIR residuals to recent reference lab results. Run split samples — analyze the same sample by both NIR and the reference method on the same day.
If reference lab values vary widely on the same sample, the problem is in your reference data — not the calibration or the instrument. Reference lab errors account for 30–50% of total NIR prediction error in many real-world operations. This factor is consistently overlooked when troubleshooting begins with the instrument.
Consistent reference data is not optional. It is the foundation the entire calibration model is built on. For more on reference method accuracy and its effect on NIR performance, see our article on why reference methods limit NIR accuracy.
7. Verify Product Consistency and Supplier Changes
Talk to procurement and production. Ask about recent raw material changes — new suppliers, different crop varieties, altered processing conditions, or seasonal shifts in composition.
Any of these changes can push current samples outside the range your calibration was built on. Use your software's built-in diagnostics — Mahalanobis distance, use statistics, or Q-residuals — to detect samples that fall outside the calibration space. Samples flagged as outliers by these tools are not being predicted reliably, regardless of how good the model looks on paper.
8. Observe Operator Technique and Training
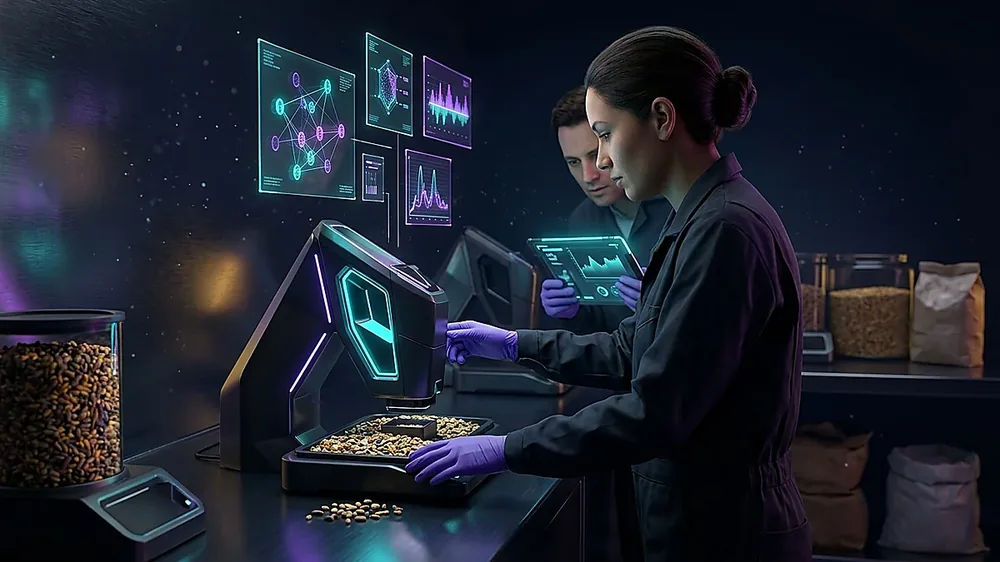
Inconsistent operator technique is a silent calibration killer. The instrument and model can both be perfectly valid, but result scatter caused by human variation looks identical to a calibration failure on paper.
Watch multiple operators prepare and present samples. Look for differences in:
- Fill height and packing pressure
- Shaking or leveling technique
- Cell or cup cleaning between samples
- Time pressure during high-volume shifts
Variations between shifts and operators can cause significant result scatter. Regular training refreshers and written, step-by-step procedures reduce this risk. If you find meaningful differences between operators, address technique before adjusting the calibration.
9. Document and Track Bias Over Time
Set up a routine to run check samples weekly and log the results. NIR instruments rarely fail suddenly — they drift gradually. Tracking bias over time lets you catch drift early, before results become unacceptable.
A simple control chart with your check sample results is enough. Plot the bias — the difference between NIR prediction and reference value — over time. A steady trend in one direction signals instrument drift or an emerging sample population shift. An abrupt step change often points to a specific event: a lamp replacement, a software update, or a new product lot.
Early detection allows timely slope/bias correction or maintenance scheduling, which is far less disruptive than dealing with out-of-specification results after the fact. Our article on NIR calibration validation pitfalls and keeping performance reliable over time covers how to structure this monitoring program.
10. Decide When to Recalibrate or Apply Bias Corrections
After working through steps 1–9, you will have enough information to make a clear decision.
- Apply a slope/bias correction when the calibration model is still valid but results show a consistent, systematic offset. This is the right fix when the product population is the same but instrument output has shifted slightly.
- Recalibrate with new reference samples when the product population has changed significantly — new ingredient sources, processing changes, or new analyte ranges that fall outside the original calibration set.
Do not jump to recalibration without first ruling out instrument drift and sample prep issues. Recalibrating on top of an unresolved instrument problem produces a new model that carries the same error forward. For a full walkthrough of when each approach applies, see our guide on building NIR calibration models and avoiding common chemometric mistakes.
Summary
Most NIR calibration problems are not calibration failures. Instrument drift, sample prep inconsistencies, and reference lab errors cause the majority of prediction problems in food and feed labs. Work through this checklist step-by-step. Isolate the root cause before investing in expensive recalibration or vendor service calls.
The best defense against calibration headaches is a simple routine: run check samples weekly, track bias on a control chart, maintain your instrument on schedule, and train operators to follow documented procedures. These four habits resolve or prevent the majority of problems covered in this checklist.
Further Reading
- (n.d.). Anomalies in Near-infrared Spectroscopy. Discusses anomalies, artifacts, and common errors in vibrational spectroscopy techniques. https://www.s-a-s.org/assets/docs/0470027320_Anomalies_in_Near%E2%80%90Infrared_Spectroscopy.pdf
- (n.d.). Troubleshooting Guides NIR UV VIS. Process Insights offers various troubleshooting guides for NIR UV VIS analyzers. https://www.process-insights.com/products-3/nir-uv-vis-process-and-lab-analyzers/troubleshooting-guides-nir-uv-vis/
SpectroScience students get access to the Calibration Validation Tracker — track RMSECV, RMSEP, bias, and slope correction across calibration updates and instrument transfers. Available as a free download in the student resource library.
Access the Excel libraryRelated Articles
Free tool — Calibration Metrics Calculator: Enter your reference values and NIR predictions in the Calibration Metrics Calculator to compute RMSEP, RPD, R², and bias the way our course teaches it — with interpretation thresholds for grain, dairy, and feed. Open the Metrics Calculator →
Free tool — Model Diagnostics Calculator: Drop your spectra and predictions into the Model Diagnostics Calculator to flag outliers via Mahalanobis distance, use, and Q-residuals — the same diagnostics we walk through in Lesson 25. Open the Diagnostics Calculator →
Free tool — Beer-Lambert Calculator: The Beer-Lambert Calculator works the absorbance = ε·b·c relationship in both directions — useful when sizing path length for a new sample type or sanity-checking a calibration curve. Open the Beer-Lambert Calculator →
Free tool — NIR Feasibility Checker: The NIR Feasibility Checker walks you through five questions about your sample and analyte and tells you whether NIR is the right tool — or whether wet chemistry will still beat it for your matrix. Open the Feasibility Checker →
NIR Fundamentals Course — Lesson 31: Troubleshooting & Problem Solving
This lesson focuses on troubleshooting and problem-solving strategies specifically for NIR instruments. It provides practical guidance on identifying and resolving common issues that can affect calibration and instrument performance, which aligns with the diagnostic checks highlighted in the article.
Explore Lesson 31 in the NIR Fundamentals courseWant to Master NIR Spectroscopy?
Our 32-lesson online course covers everything from Beer-Lambert Law to PLS calibration — built for food, grain, feed, and dairy professionals.