Reject or Accept in Seconds: How NIR Transforms Grain Receiving Decisions at the Intake Point
NIR in grain receiving delivers moisture, protein, and starch results in 30 seconds at the scale. Learn how it works and why calibration is critical.
· 11 min read · Vitaly Kirkpatrick
A single high-moisture load slipping through at receiving can cost $40,000 in spoilage and dryer fuel before anyone realizes the scale of the problem. At 3am at a feed mill, ingredient deliveries are queued and the operator must decide whether to accept or reject a batch within minutes. Without real-time analysis, every option is bad: wait for a lab that opens hours later, discount entire loads and lose margin, or accept material that fails quality checks days later — costing tens of thousands in rework and downtime. These outcomes are documented. None are acceptable.
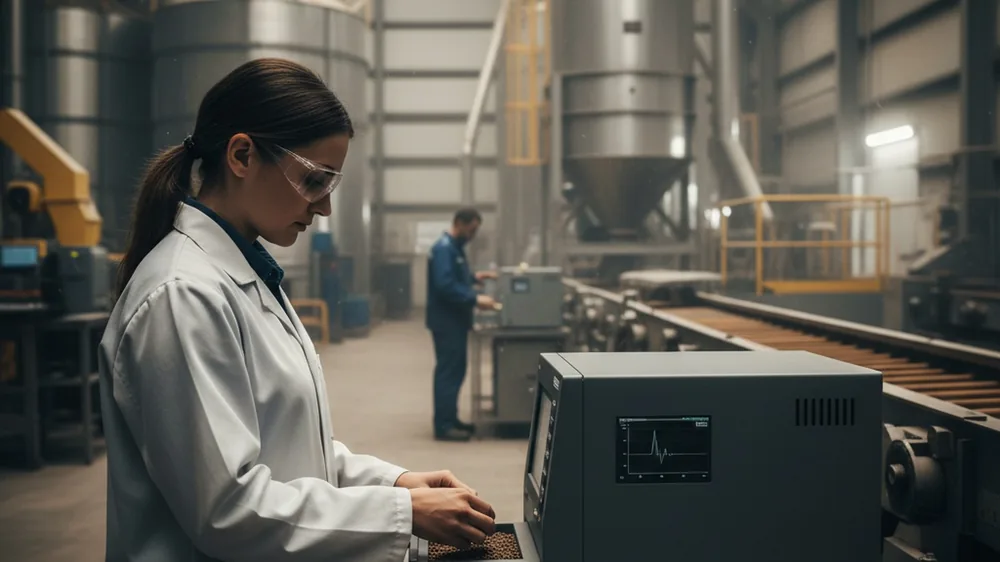
A benchtop NIR analyzer delivers moisture, protein, fat, and starch results in about 30 seconds, right at the processing line, without destroying the sample. This isn't a lab demonstration. It's standard practice at high-throughput grain elevators and feed mills today. Operations not yet using it are making costly purchasing decisions blind.
Beyond the Visible: What NIR Actually Is
You can't see the chemistry in a grain sample — but near-infrared light can read it. Visible light runs roughly 380 to 780 nanometers. Just past the red end of that range — from about 780 to 2500 nanometers — sits the near-infrared region, invisible to the human eye but packed with chemical information.
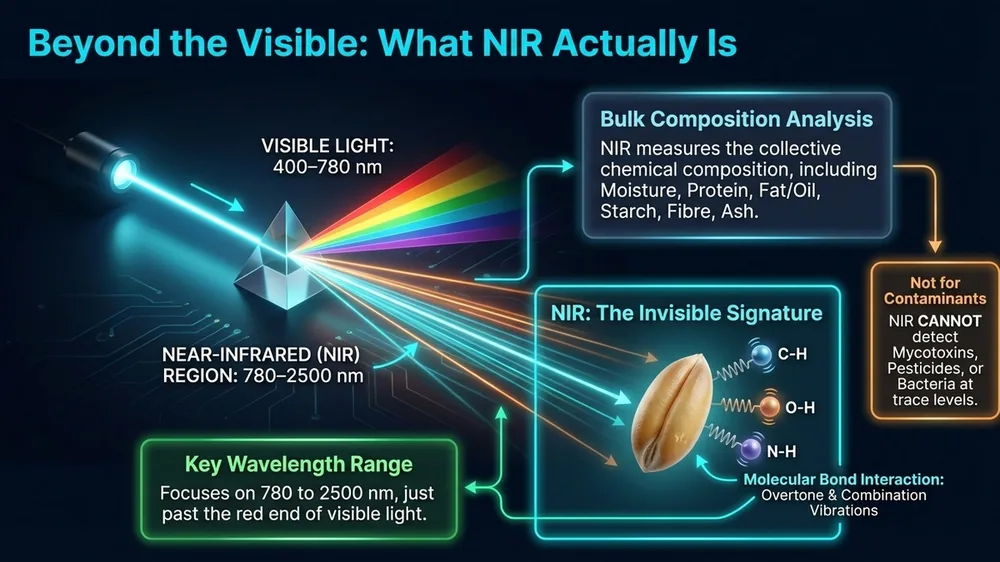
Near-infrared light doesn't bounce off the surface of a grain sample. It penetrates into it and interacts with molecular bonds — specifically C-H, O-H, N-H, and S-H bonds. Those bonds define water, protein, fat, and starch. When near-infrared energy hits those bonds, they absorb it and vibrate at characteristic frequencies.
Think of it like plucking different strings on a guitar. Each string gives a different note. Each chemical bond gives a different absorption pattern. That pattern is the chemical fingerprint of your sample.
The real advantage in grain receiving isn't just the parameters being measured — it's how they're measured. Near-infrared light penetrates bulk material, so a handful of grain, a powder, or a pellet can be scanned with no grinding, dissolving, or complex preparation. When receiving lines move fast, that speed and simplicity are decisive. Learn more about how NIR spectroscopy works in food and feed.
How the Instrument Turns Light Into Numbers
Every time a grain sample goes under the optics, the instrument does one core job: it shines near-infrared light at the sample and measures how much is absorbed at each wavelength across the full range. The result is a spectrum — a curve showing absorption intensity from roughly 780nm to 2500nm. Every chemical compound in the sample leaves its own mark on that curve.
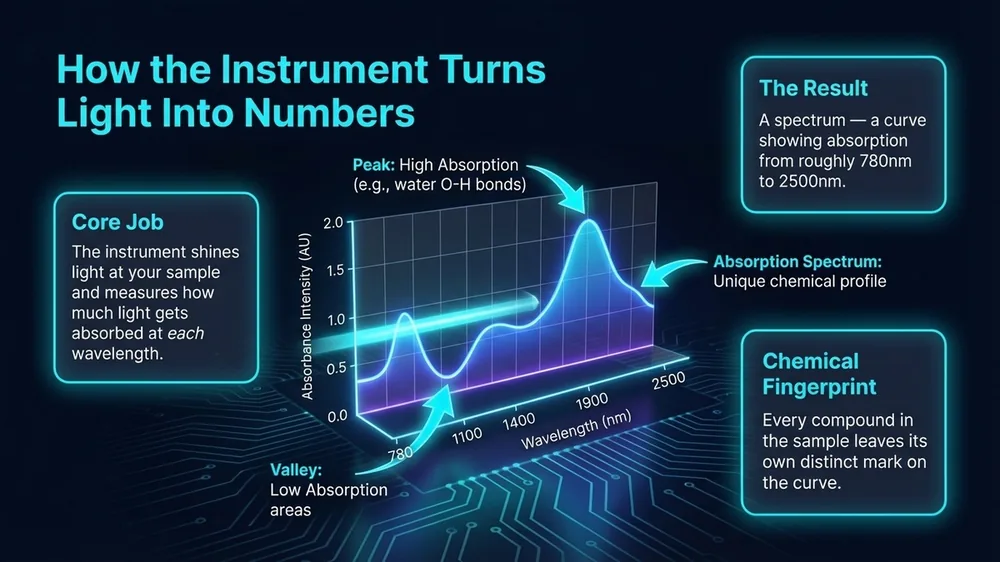
One point that trips up new users: the absorptions seen in near-infrared aren't the clean, basic vibrations from a chemistry textbook. They're overtones and combination bands — weaker, broader, and overlapping with each other. A moisture peak doesn't sit cleanly by itself. It's mixed in with signals from protein and starch.
Two samples with meaningfully different compositions can produce spectra that look nearly identical to the eye. That's not a flaw in the technology. It's the physics of near-infrared, and it's exactly why chemometrics exist.
Chemometrics: The Brain Behind the Measurement
Think of a chemometric model like teaching a new grain grader to recognize quality by pattern — except instead of sensory impressions, a mathematical model learns to recognize patterns in spectra. It's shown hundreds of samples where the answer is already known from wet chemistry. It learns which spectral patterns correlate with which protein levels, which moisture readings, which oil percentages. Once trained, it reads a new sample's spectrum and returns composition results in seconds.
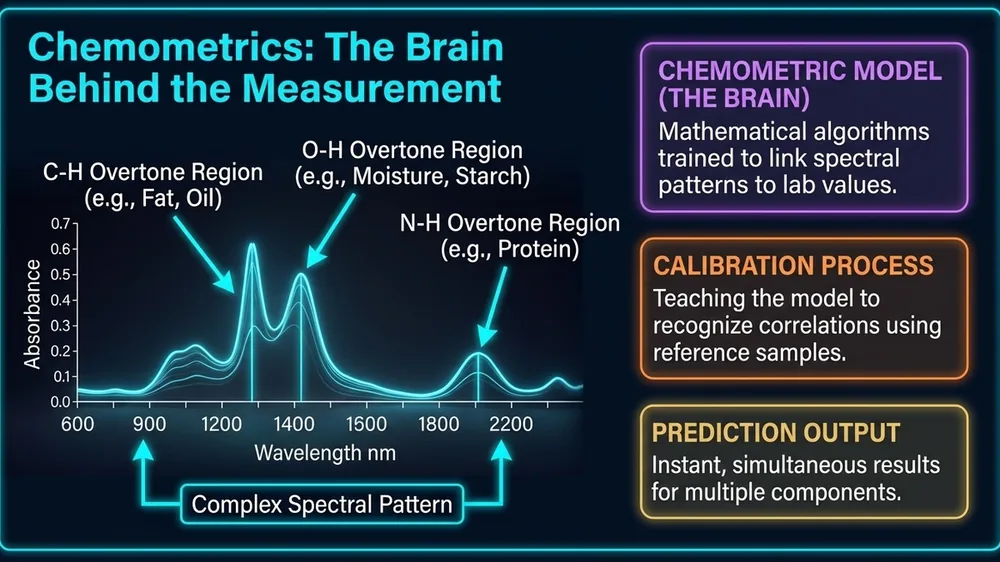
The most common approach is Partial Least Squares regression, or PLS. It finds the mathematical directions in spectral data that best explain the variation in reference values. The calibration model is a compressed, refined summary of everything those hundreds of reference samples taught it.
The instrument doesn't measure chemistry directly — it measures patterns in light absorption, and chemometrics translates those patterns into numbers. The quality of that translation depends entirely on how well the calibration model was trained and how well it still matches incoming grain.
Quality managers often ask me why their instrument starts giving odd readings mid-season without any obvious instrument fault. Here's what's usually happening: a model trained on North American hard red winter wheat won't give reliable numbers on soft white wheat from a different region. I've seen this unfold at a grain elevator in western Canada that expanded its sourcing to Eastern European origins mid-season — the instrument kept reading, the numbers kept printing, and nobody caught the drift until the protein premiums were already paid out. Your calibration is not a one-time setup. It must cover the range of grain varieties, growing conditions, and harvest years that actually come through your facility. Models degrade when incoming grain drifts outside what they were trained on — and in a challenging harvest year, that drift can be fast.
Watch out: A calibration model trained on one wheat variety or growing region will produce unreliable results when applied to different grain. Errors start small and grow. New varieties, different origins, or unusual weather all push incoming grain outside the model's trained range — with no visible warning from the instrument.
What's Inside the Instrument
Knowing the basic architecture of an NIR spectrometer helps you make better purchasing decisions and troubleshoot problems faster. Every instrument shares the same fundamentals: a light source, a method for separating wavelengths, a detector, and software to process the signal. Where instruments differ is in how they separate wavelengths — and that choice has practical consequences for grain receiving environments.
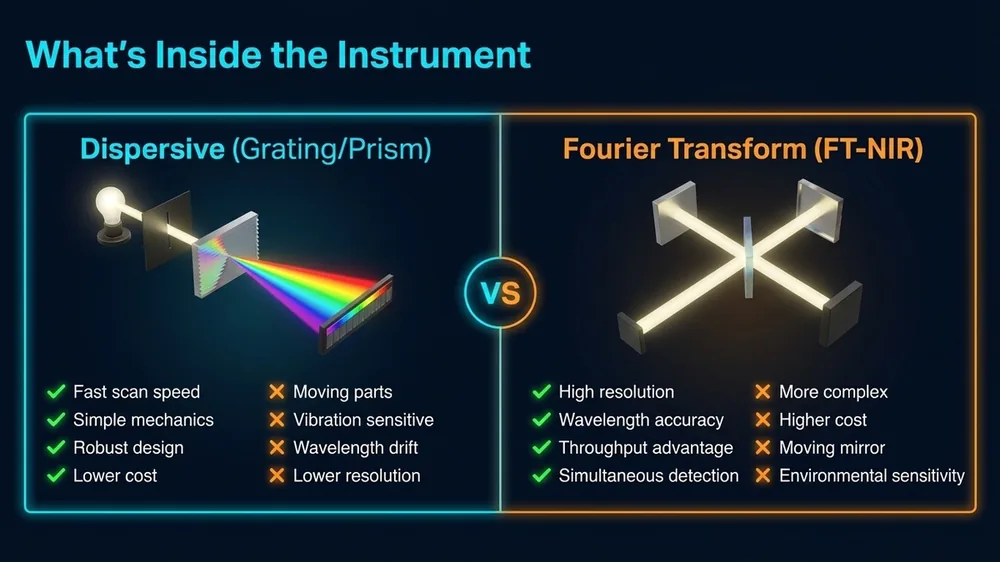
Scanning grating instruments use a moving grating to sweep through wavelengths one by one. They cover the full NIR range with high resolution, which is useful for complex matrices. The tradeoff is moving parts — and moving parts eventually wear or drift.
Diode array instruments use a fixed grating with multiple detectors that measure simultaneously. No moving parts means faster data acquisition and better durability in harsh conditions. That matters in grain receiving pits where dust, vibration, and temperature swings are routine.
Fourier Transform NIR (FT-NIR) instruments use an interferometer to collect the full spectrum at once. They're known for high resolution and excellent wavelength reproducibility — important when transferring calibrations between instruments across multiple facility locations.
Filter-based and LED-based instruments are a newer category worth knowing. They measure only a handful of specific wavelengths rather than the full spectrum. They're smaller, cheaper, and purpose-built for specific applications — such as a dedicated inline moisture sensor on a grain dryer. Your receiving lab typically needs a full-spectrum instrument for flexibility. A production floor application may be well-served by something simpler and more rugged. See how different NIR instrument types compare for grain and feed operations.
What NIR Measures in Grain Receiving
The financial case for real-time analysis at the scale comes down to which parameters actually drive purchasing decisions, grading premiums, and downstream process performance. For grain and oilseeds at the receiving scale, a well-calibrated instrument routinely measures the following:
- Moisture — the most common measurement and the one with the most direct financial consequence. A 1% moisture error on a 50,000-bushel corn purchase can cost $8,000 to $12,000 depending on market price and drying cost.
- Protein — important for wheat grading, milling contracts, and feed formulation. A feed mill buying wheat shorts for broiler rations needs protein accuracy within 0.5% to hold formula consistency. Miss that window and the nutritionist is reformulating mid-production run.
- Oil / Fat — needed for oilseed receiving at crush facilities and for high-fat commodities like full-fat soybeans entering feed production. At a soybean crush plant, oil content at intake directly affects extraction yield projections and hedging position.
- Starch — relevant for corn entering wet-milling or ethanol production, where starch yield drives the entire process economics. A 1% starch variance across a week's intake at a corn starch plant can translate to a real yield shortfall before it shows up in production data.
- Fiber — measured in byproduct streams and specialty grains where fiber fraction affects nutritional value or processing behavior.
Where NIR Fits in the Receiving Workflow
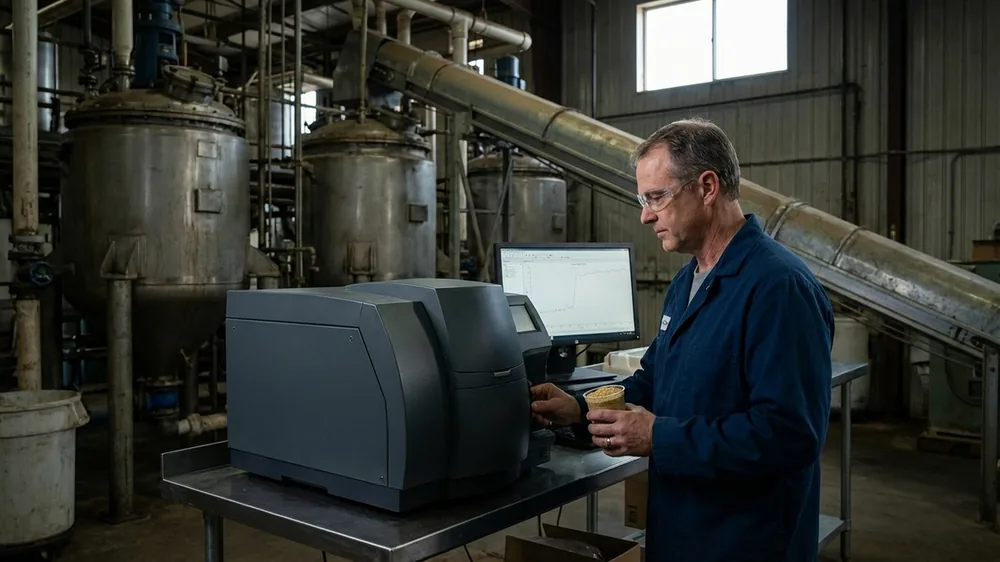
The instrument delivers value only when it's positioned correctly in the workflow. At most grain elevators and feed mills, the sequence looks like this: a truck arrives, a probe sample is pulled from the load, the sample goes directly to the NIR instrument at the receiving office or pit-side station, results print or display within 30 seconds, and the operator makes an accept/reject/discount decision before the truck moves to the unloading bay.
That sequence only works if sampling is done properly. A probe sample pulled from one side of the truck doesn't represent a 25-tonne load with moisture gradients from field drying. I've seen receiving operations invest in a quality instrument and then undermine it completely with inconsistent sampling — one grab from the top of the load, different every time. The instrument was accurate. The sample wasn't representative. The result was the same as having no instrument at the scale.
The practical standard is a composite probe sample drawn from multiple points across the load depth, mixed, and presented to the instrument as a uniform sub-sample. That takes an extra two minutes. It's worth every second.
Here's a failure mode that doesn't get discussed enough: operators who trust the number on the screen without checking whether the sample presentation was consistent. If your grain has visible clumping, foreign material, or high surface moisture from rain exposure, a single instrument scan won't capture that variation. Build a protocol — written, posted at the station — that defines exactly how samples are collected, mixed, and loaded into the instrument cup. Your auditors will want to see it anyway, and it protects you when a supplier disputes a rejection.
Keeping the Calibration Current
A calibration that worked well last harvest may give you trouble this harvest. Weather, new varieties, different growing regions — all of these shift the chemical profile of incoming grain in ways the original training set may not cover. The instrument won't warn you. It'll simply return a number that looks plausible but drifts from reality.
The standard check is straightforward: pull 10 to 20 samples per week during peak receiving, run them through the instrument, then send the same samples to your reference lab. Compare the results. If the instrument and lab agree within the expected tolerance, you're in range. If they start diverging — especially at the extremes of moisture or protein — your calibration needs attention before the gap grows wide enough to cost real money.
During plant visits I've observed this problem more than once. At a sunflower seed receiving station I worked with, the operation ran without a routine verification check for most of the season. By the time anyone compared the instrument readings against reference lab values, the oil calibration had drifted 1.5% low across the board. Every load accepted that season had been purchased at a premium the actual oil content didn't justify. The instrument was functioning perfectly. The calibration had simply aged out of the current crop.
Ongoing monitoring isn't optional maintenance — it's the operating cost of running reliable real-time quality control at the receiving point.
What to Do Before Your Next Receiving Season
If your operation is already running NIR at receiving, the question isn't whether the instrument works — it's whether your calibration still matches this year's incoming grain. Pull your last 30 days of instrument results. Compare them against any lab checks you ran in parallel. Look for consistent bias: if the instrument is reading consistently high or low on moisture or protein, the calibration has drifted and needs updating before volume picks up.
If you're not yet running real-time analysis at the scale, start with moisture on your highest-volume commodity. That single parameter, measured correctly on every load, pays back the instrument cost faster than any other application in grain receiving. Once that baseline is running reliably, add protein or oil depending on what drives your purchasing premiums.
The technology is mature. The calibrations are available. The financial case is straightforward. What separates operations that get full value from those that don't is the discipline to maintain the system — checking samples, verifying against the lab, and updating the model when the grain changes. Build that habit before the season starts, not after the first expensive discrepancy forces the conversation.
Free tool — Calibration Metrics Calculator: Enter your reference values and NIR predictions in the Calibration Metrics Calculator to compute RMSEP, RPD, R², and bias the way our course teaches it — with interpretation thresholds for grain, dairy, and feed. Open the Metrics Calculator →
Free tool — NIR Glossary: Unfamiliar with a term? The SpectroScience NIR Glossary defines every chemometrics, calibration, and instrument term used in this article in plain language with worked examples. Open the Glossary →
SpectroScience students get access to the NIR Decision Tree — step-by-step framework for deciding when NIR is the right measurement tool vs. wet chemistry. Available as a free download in the student resource library.
Access the PDF libraryNIR Fundamentals Course — Lesson 14: Food & Feed Industry
This lesson explores the application of NIR technology specifically within the food and feed industry, detailing how it enhances quality control processes. It emphasizes the importance of real-time analysis for making informed decisions at grain intake, ensuring that product standards are consistently met.
Explore Lesson 14 in the NIR Fundamentals courseWant to Master NIR Spectroscopy?
Our 32-lesson online course covers everything from Beer-Lambert Law to PLS calibration — built for food, grain, feed, and dairy professionals.