NIR fundamentals · step 4 of 7
How does garbage input affect soybean protein NIR predictions?
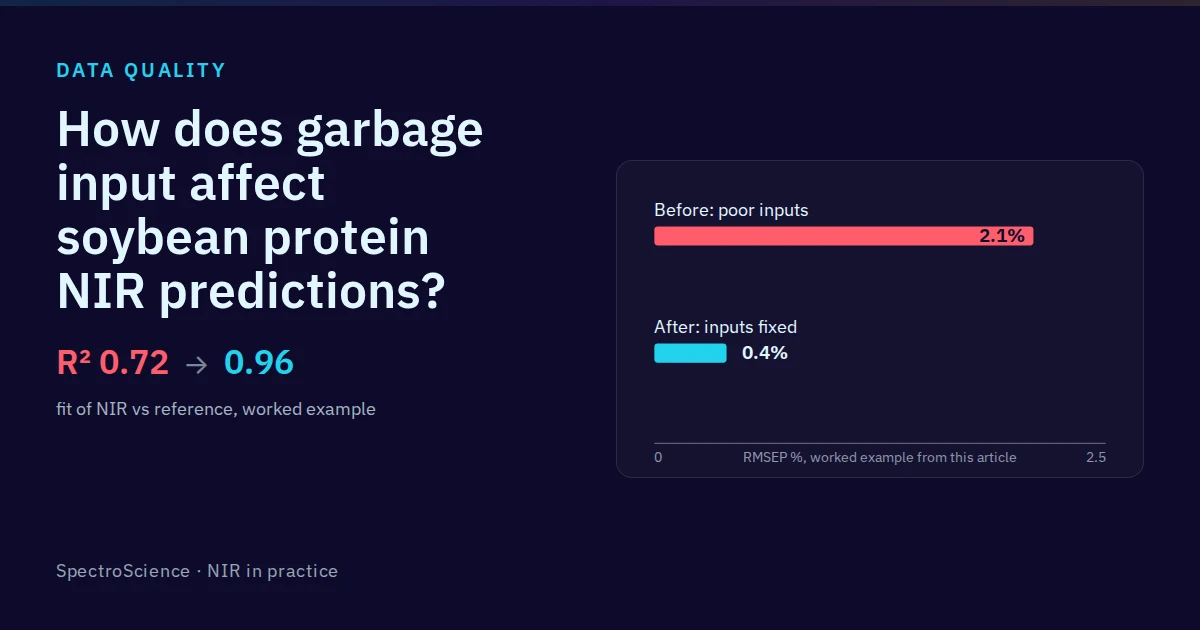
Real-World GIGO Example: Soybean Protein Failure
Take a typical case, used here as a worked example: a feed mill’s near-infrared (NIR) spectroscopy system was producing soybean protein predictions that ran 3-5% below wet chemistry reference values. That consistent gap signaled a serious data quality issue demanding immediate action.
Step-by-Step Investigation
Pinpointing the root causes of your poor data quality required a structured investigation:
- Sample Inspection: Under magnification, foreign material such as corn kernels mixed with soybeans was found in the samples.
- Grinding Equipment Check: Worn grinder blades were identified, leading to inconsistent particle sizes and spectral variability unrelated to protein content.
- Sample Presentation Evaluation: Improper packing techniques resulted in variable fill levels of sample cups, affecting density and spectral characteristics.
- Spectral Quality Assessment: Spectra showed high noise and erratic baselines, reflecting the impact of contamination, poor grinding, and inconsistent packing.
Root Causes Identified
Four primary issues were identified:
- Contamination from foreign material (corn kernels).
- Worn grinder blades causing inconsistent particle sizes.
- Lack of operator training on proper sample preparation techniques.
- Absence of replicate checks to detect variability early.
Solution Implemented
Addressing those root causes meant taking the following steps:
- Sample Cleaning Protocol: Hand-sorting was introduced to remove foreign material.
- Grinder Maintenance: New blades were installed to ensure consistent grinding performance.
- Operator Training: Sessions focused on proper sample preparation and packing techniques.
- Replicate SOP Implementation: Checklists ensured that replicate measurements were collected for every sample.
Results After Fix
Implementing those changes drove a significant enhancement in calibration performance:
- , indicating stronger correlation between NIR predictions and reference values.
- In this worked example, RMSEP falls from 2.1% to 0.4% once the inputs are fixed, about a five-fold improvement.
- Initial Calibration
- Bias Observed
- Investigation Begins
- Root Causes Identified
- Solutions Implemented
- Improved Results
This case reinforces the GIGO principle: clean up your input data, and your outputs will stabilize. Address these foundational gaps first—no amount of algorithm optimization will solve the problem otherwise.
The shift from biased predictions to accurate results proves why rigorous data quality control matters in NIR spectroscopy. You avoid costly consequences by investing in prevention strategies like training, standard operating procedures (SOPs), and regular maintenance.
Step-by-step Investigation
Your troubleshooting followed a strict sequence to isolate every source of bad data. Under magnification, you spotted corn kernels mixed with the soybeans. That contamination introduced compositional variation your calibration never encountered during development.
You then checked the grinder. Worn blades produced uneven particles—some stayed coarse while others broke into fine powder. That inconsistent grind created spectral noise unrelated to protein content.
Next, you reviewed sample presentation. Improper packing left inconsistent fill levels inside the cups. Overpacked and underfilled samples shifted density, which altered your spectral characteristics.
When you pulled up the spectra, the quality indicators jumped out. High noise, shifting baselines, and blurry peaks marked the data. Those patterns simply tracked the combined impact of contaminated beans, a dull grinder, and uneven packing.
Root Causes Identified
Four root causes emerged from this investigation:
- Contamination: Foreign material in samples introduced compositional bias.
- Grinding Issues: Worn grinder blades produced poor particle size distribution.
- Operator Errors: Lack of training led to improper sample preparation techniques.
- Quality Checks Missing: No replicate checks were performed, allowing variability to go undetected.
Solution Implemented
To resolve the issue, you implemented a series of corrective actions:
- A sample cleaning protocol with hand-sorting to remove foreign material.
- Installation of new grinder blades to restore proper grinding performance.
- Operator training sessions on correct sample preparation and packing techniques.
- Establishment of replicate SOPs with checklists for consistent quality checks.
Results After Fix
The impact was significant:
- Calibration performance improved from R² = 0.72 to R² = 0.96; however, predictive performance should also be evaluated using independent-validation or cross-validation results. [58], indicating a stronger correlation between NIR predictions and reference values.
- Prediction error (example): RMSEP 2.1% before, 0.4% after.
- Sample Contamination
- Grinding Issues
- Operator Errors
- Quality Checks Missing
- Solutions Implemented
- Improved Calibration Performance
This case highlights the GIGO principle: fixing poor data inputs leads to reliable outputs. You cannot run algorithm optimizations or calibration adjustments to cover those broken fundamentals. Addressing the root causes transformed a failing system into one producing accurate results.
Root Causes Identified
The investigation into your soybean protein calibration failure uncovered four main root causes:
- Sample Contamination
- Grinding Issues
- Operator Errors
- Lack of Quality Checks
Sample Contamination: NIR spectroscopy can detect foreign material like corn kernels through spectral analysis and chemometric classification, bypassing magnified visual checks. [59] This contamination introduced compositional variability your calibration did not account for.
Grinding Issues: Worn grinder blades create inconsistent particle sizes. Some particles remain coarse while others become fine powder, causing spectral variability unrelated to protein content.
Operator Errors: Staff without proper training pack sample cups unevenly. Inconsistent fill levels shift bulk density and alter spectral characteristics.
Lack of Quality Checks: Skipping replicate tests allows variability to go unnoticed until calibration accuracy takes a hit.
Together, these factors drove the systematic bias between your NIR predictions and wet chemistry reference values. Address each issue at its source to keep your calibrations reliable.
Sample contamination
Not quite. The section states that both sample contamination and operator errors were identified as root causes.Operator errors
Not quite. The section states that both sample contamination and operator errors were identified as root causes.Both A and B
Correct. The section states that both sample contamination and operator errors were identified as root causes.Solution Implemented
You tackled each root cause from your investigation with targeted corrective actions. You established a sample cleaning protocol that uses hand-sorting to remove foreign material like corn kernels mixed with soybeans. This kept only pure soybean samples in the calibration process.
Next, you swapped out worn grinder blades for new ones to restore proper grinding performance and achieve consistent particle sizes. That reduced spectral variability unrelated to protein content, improving the accuracy of your NIR predictions.
You also ran operator training sessions to walk staff through proper sample preparation techniques, including how to pack sample cups correctly. Those sessions emphasized maintaining consistent fill levels to avoid density variations that could affect spectral characteristics.
Finally, you rolled out a replicate standard operating procedure (SOP) with detailed checklists so teams collected and evaluated replicate measurements for every sample. This helped detect variability early and allowed for immediate corrective actions before it impacted calibration performance.
Together, these steps addressed the contamination issues, grinding inconsistencies, operator errors, and lack of quality checks that had previously compromised data quality. Implementing these measures gave your feed mill significantly improved NIR protein prediction accuracy and reliability.
Establishing a sample cleaning protocol
Correct. First, a sample cleaning protocol was established with hand-sorting to remove foreign material.Replacing grinder blades
Not quite. First, a sample cleaning protocol was established with hand-sorting to remove foreign material.Conducting operator training sessions
Not quite. First, a sample cleaning protocol was established with hand-sorting to remove foreign material.Results After Fix
In this example, corrective actions drove a dramatic improvement in calibration performance. Your R² value climbed from 0.72 to 0.96, showing a much stronger correlation between NIR predictions and reference values. Prediction error also decreased significantly, with RMSEP dropping from 2.1% to 0.4%, marking a five-fold reduction. Visually, the scatter plot shifted from widely scattered points to a tight cluster along the ideal prediction line.
This case study reinforces the GIGO principle: fixing poor data inputs directly improves your analytical outputs. You can run algorithm optimizations and calibration adjustments all day, but no technical intervention compensates for fundamental issues like poor sample quality, inconsistent grinding, operator technique, and a lack of replicates. Fixing those root causes remains essential for reliable results.
Say a feed mill starts with an RMSEP of 2.1%, driving frequent rework and potential product recalls. Once you implement the corrective measures, that RMSEP drops to 0.4%, drastically reducing the likelihood of errors and associated costs. This transformation highlights why robust data quality control practices remain essential for accurate and reliable NIR analysis.
Comparison of Calibration Performance Before and After Fixes
The table below compares your soybean protein calibration metrics before and after you tackle data quality issues.
| Metric | Before Fix | After Fix |
|---|---|---|
| R² | 0.72 | 0.96 |
| RMSEP (%) | 2.1 | 0.4 |
It highlights the significant improvements in calibration accuracy and reliability you achieve once those corrective steps take hold.
FAQ
What are direct costs of poor data quality?
Wasted time follows product recalls ($50k) and lost business ($200k+), while you absorb approximately $5,000/month in labor costs.
How do indirect costs compare to direct ones?
You spend about 40 hours a month troubleshooting and handling regulatory issues. These indirect costs often exceed direct expenses, even though they’re harder to quantify.
What is the cost of prevention versus correction?
Prevention ($4,500/month) stays 5-10 times cheaper than dealing with garbage data consequences (~$25k+/month).
Why is quality important in NIR spectroscopy?
Strong quality practices deliver accurate, precise, and traceable results that support your reliable decision-making.
What are the key prevention strategies for NIR analysis?
SOPs, calibration checks, sample verification, environmental monitoring, replicate analysis, and operator training.
Your next question
Build calibrations that hold up
See the NIR calibration courseAsk a questionSources
- Beyond the Status Quo: Particulate Matter Standards in Oral Dosage Forms.
- Predictive Artificial Intelligence Models for Mycotoxin Surveillance and Mitigation in Poultry Production Systems.
- Care of the Newborn and Cord During the Third Stage of Labour (Scientific Impact Paper No. 78).
- Balanced Animal Nutrition for Better Feeds, Healthy Animals, Safe Food, and a Healthy Planet: A One Health Perspective-An Invited Review.
- Current PAT Landscape in the Downstream Processing of Biopharmaceuticals.
- Near-Infrared Spectroscopy in Bio-Applications
- A Review of Machine Learning for Near-Infrared Spectroscopy
- Assessment of Polysaccharides from Mycelia of genus Ganoderma by Mid-Infrared and Near-Infrared Spectroscopy
- Transformer Models in Vibrational Spectroscopy: A Review.
- Development of a portable online nondestructive detection device for apple watercore based on visible/near-infrared spectroscopy.
- Optical Spectroscopy and Spectral Imaging for Bladder Cancer Detection and Characterisation: A Scoping Review of Diagnostic Evidence and Tra
- Recent Advances in Sensing Strategies for the Detection and Discrimination of Tea Polyphenols.
- The Evolution of Next-Generation Glucose Monitoring Systems: Developments from Conventional Diagnostics to Wearable and Continuous Sensing P
- Advancing Egg Freshness Evaluation with Integrated AI and Spectroscopy.
- Tri-Band Vis-NIR Spectroscopy with Color Residual-Variance Gated Attention Fusion for Rapid Assessment of Hongmeiren (<i>Citrus reticu
- Method Adaptation Patterns and a Selection Framework for Near-Infrared Spectroscopy-Based Moisture Prediction of Major Grain Crops.
- AI-Driven Nondestructive Measurement Technologies for Meat Quality and Safety: A Review.
- Rapid Detection of Deoxynivalenol in Soybeans by NIR Spectroscopy Coupled With ETs-PLS Feature Selection Method.
- Explainable residual CNN with Gramian Angular Field encoding for rapid quantification of soil properties using near-infrared spectroscopy.
- Responses of soil carbon storage to tending thinning and rapid prediction based on NIRS-BPNN in larch-birch natural secondary forests.
- Microfluidics-Integrated Spectroscopic Technologies for Food Safety and Quality Assessment: From Complex-Matrix Processing to On-Site Decisi
- Detection of Frost-Damaged Maize Kernels for Food Quality Screening Using Hyperspectral Imaging and 2D-COS-Assisted Deep Learning.
- Applications of NIR Spectroscopy and Chemometrics for Food Authentication and Safety: Detection of Adulterants and Contaminants.
- Hyperspectral Imaging for Agricultural and Food Sensing: Applications, Data Analytics, and Deployment Challenges.
- Acoustic Detection of Insects in Stored Products in the Presence of Strong Ambient Noise.
- Welfare of pigs on farm.
- Postharvest Fruit Grading Technologies and Equipment: A Review.
- Detection, Differentiation and Quantification of Major Sugar Based Adulterants in Honey Using FTIR-ATR Spectroscopy Coupled with Chemometric
- From optical architectures to actual deployment a review of online process spectroscopy in industrial environments.
- Therapeutic Potential of Alkanna tinctoria Root in Ameliorating Obesity-Associated Hepatic, Adipose, and Reproductive Dysfunctions in Diet-I
- Multifunctional Vertical Bulk-Heterojunction Transistors With Amorphous GaO<sub>x</sub> for Neuromorphic Perception-to-Decision.
- A High-Speed Real-Time Sorting Method for Fabric Material and Color Based on Spectral-RGB Feature Fusion.
- Research Progress on Bioinspired Superhydrophobic Photothermal Anti-/Deicing Coatings.
- Multimodal AI for Real-Time Food Safety and Quality: From Sensors to Foundation Models, Edge Deployment, and Regulation.
- INTERPOL Review of Forensic Biology and DNA, 2023-2025.
- Metal Nanocomposites as Biosensors for Biological Fluids Analysis.
- AI and Biotechnology to Combat Aflatoxins: Future Directions for Modern Technologies in Reducing Aflatoxin Risk.
- Integrated microwave cavity perturbation sensor for nondestructive estimation of moisture content of grains: A case study on wheat and chick
- Comparative assessment of endogenous lipid transfer protein (LTP) level in genetically modified maize for its relevance in safety assessment
- Microwave Sensing and Imaging Technology in Food Applications: A Comprehensive Review.
- Application of machine learning techniques to predict the compressive strength of steel fiber reinforced concrete.
- Pelvic Floor Muscle Training Following Surgery for Pelvic Organ Prolapse: Recommendation from Scientific Literature.
- Chromatin conformation, gene transcription, and nucleosome remodeling as an emergent system.
- A deep dive into herbal extraction: Techniques, trends, and technological advancements.
- AI in Drug Discovery: Clinical Failures, Regulatory Reality, and the Validation Crisis Behind the Hype.
- Modeling decision dynamics disentangles working memory, cognitive control and reinforcement learning and reveals clinical differences.
- Safety and Performance Evaluation of a Clinical Decision Support System for Imatinib Therapeutic Drug Monitoring: In Silico Study.
- Fibre phantom generation using FibreSimulator: an open-source Python tool.
- From phenoscope to GreenLab model of Arabidopsis to decipher genotype and treatment effects.
- TUSCO: benchmarking transcriptome reconstruction with endogenous single-isoform controls.
- Selecting Between Whole-Sample and Split-Sample Strategies for Exploratory and Confirmatory Factor Analyses: Guidance for Psychometric Scale
- The Foreign Emoluments Clause
- Synchronized application of closed-loop NMES and precision tACS in post-stroke hand rehabilitation: a protocol of neurorehabilitation trial
- Occupational exposure to bioaerosols in the Norwegian salmon processing industry.
- Hydrogel-Mediated Sustained Delivery of Corneal Epithelial Extracellular Vesicles: A Strategy for Enhanced Corneal Regeneration.
- Industrial-Scale Cleaning Solutions for the Reduction of <i>Fusarium</i> Toxins in Maize.
- https://doi.org/10.7717/peerjcs.583/table-6
- https://pmc.ncbi.nlm.nih.gov/articles/PMC13425625/
- https://onlinelibrary.wiley.com/doi/abs/10.1155/aia/2178168
Draft, not published. $0 fact-check against the original's own sources: gate FIX. Template gate: worked example.