Spectra Lab — chemometrics in your browser
Spectra Lab: chemometrics software for near-infrared calibration, in your browser
Partial least squares regression (PLS), principal component analysis and spectral preprocessing (SNV, MSC, Savitzky-Golay) for near infrared spectroscopy (near-infrared, NIR) data — upload spectra, compare SNV, MSC and derivatives, validate with RMSECV and RPD, and flag outliers with Hotelling T2. No install, no vendor lock-in.
Works with spectra from any NIR instrument — if you can export it as a table of numbers, Spectra Lab can calibrate on it.
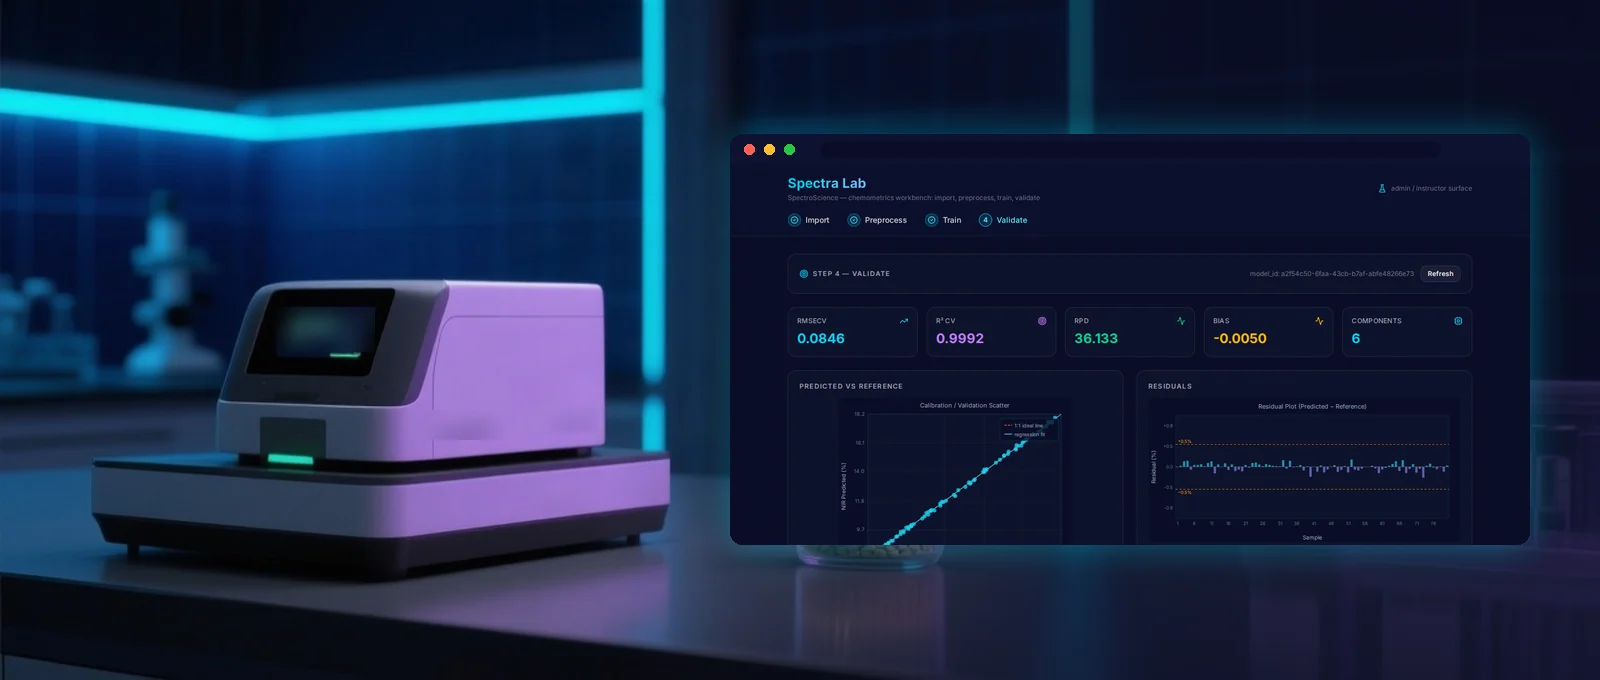
Interactive demo: spectral preprocessing, PLS regression and model validation
Choose a preprocessing method and watch what it does to the spectra, the RMSECV-versus-components curve, the predicted-versus-reference scatter, and the validation metrics. Pick raw spectra first, then try SNV.
Results computed by the Spectra Lab engine on a simulated teaching dataset (80 samples, moisture %). Simulated data, not real grain measurements.
What is a Savitzky Golay filter (Savitzky-Golay algorithm)?
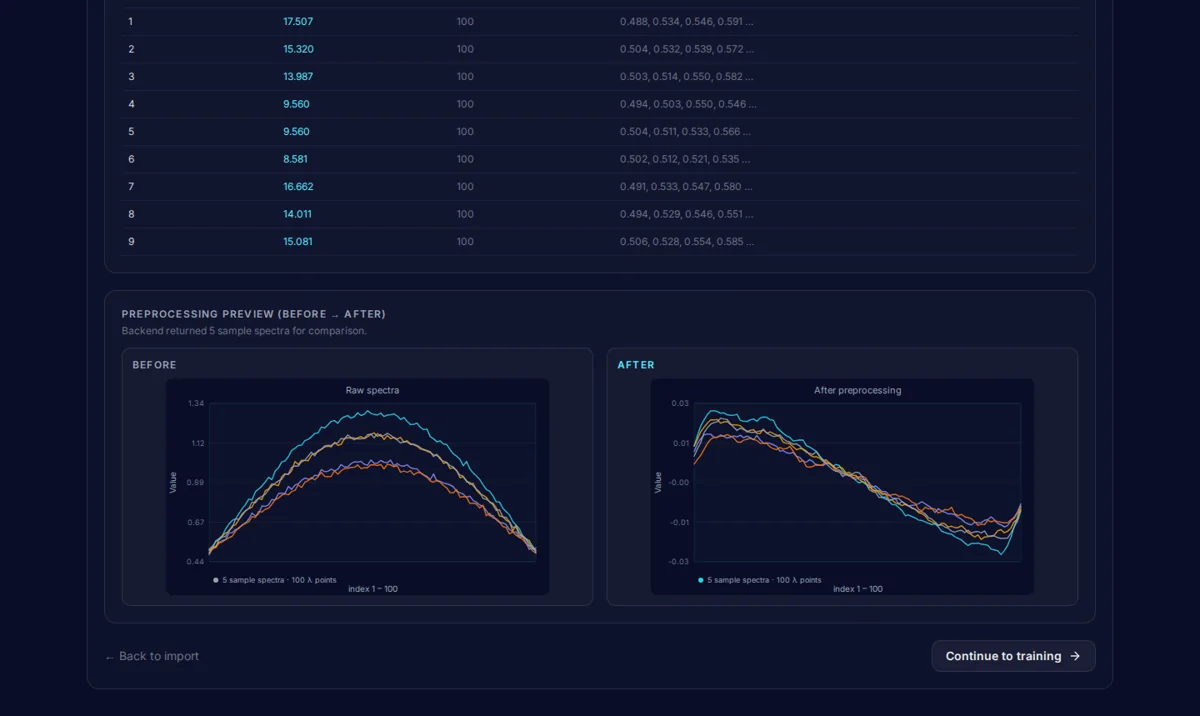
A Savitzky Golay filter (also written Savitzky-Golay; the Savitzky-Golay algorithm or Savitzky-Golay smoothing) fits a low-order polynomial to a short moving window of points along each spectrum. The fitted value smooths noise; the fitted slope or curvature gives the first or second derivative, which removes baseline offsets and slopes before partial least squares regression. Window size and polynomial order set the trade-off between noise removal and losing real absorption features. In the demo above, compare "SG 1st derivative" and "SG 2nd derivative" with the raw spectra to see that trade-off on real data.
Tour the Lab
Six screens take you from a raw CSV to a filed validation report. Pick a step on the left; on a phone the tabs scroll sideways.
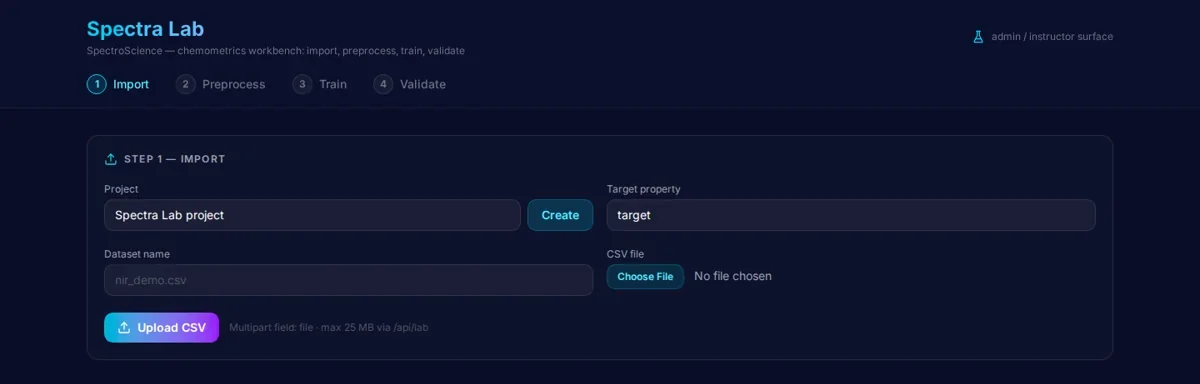
Upload a CSV with one row per sample and your reference values alongside the wavelengths. Spectra Lab previews the table so you can check the columns, the row count and the reference range before anything is computed.
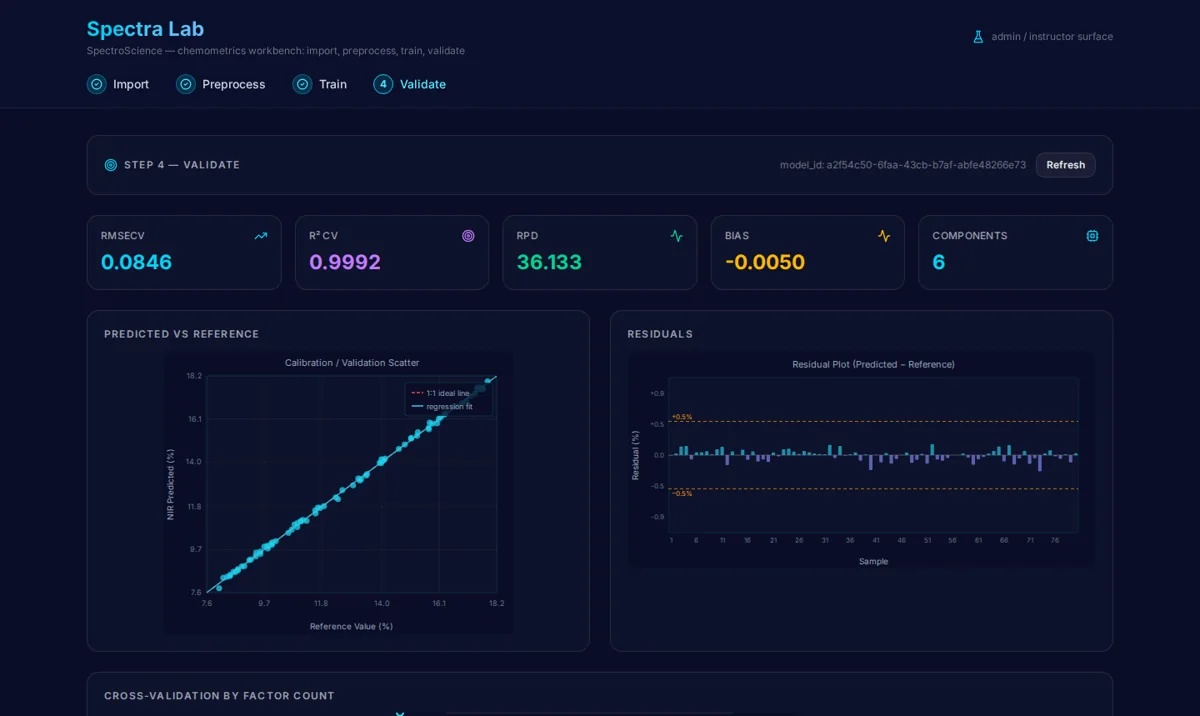
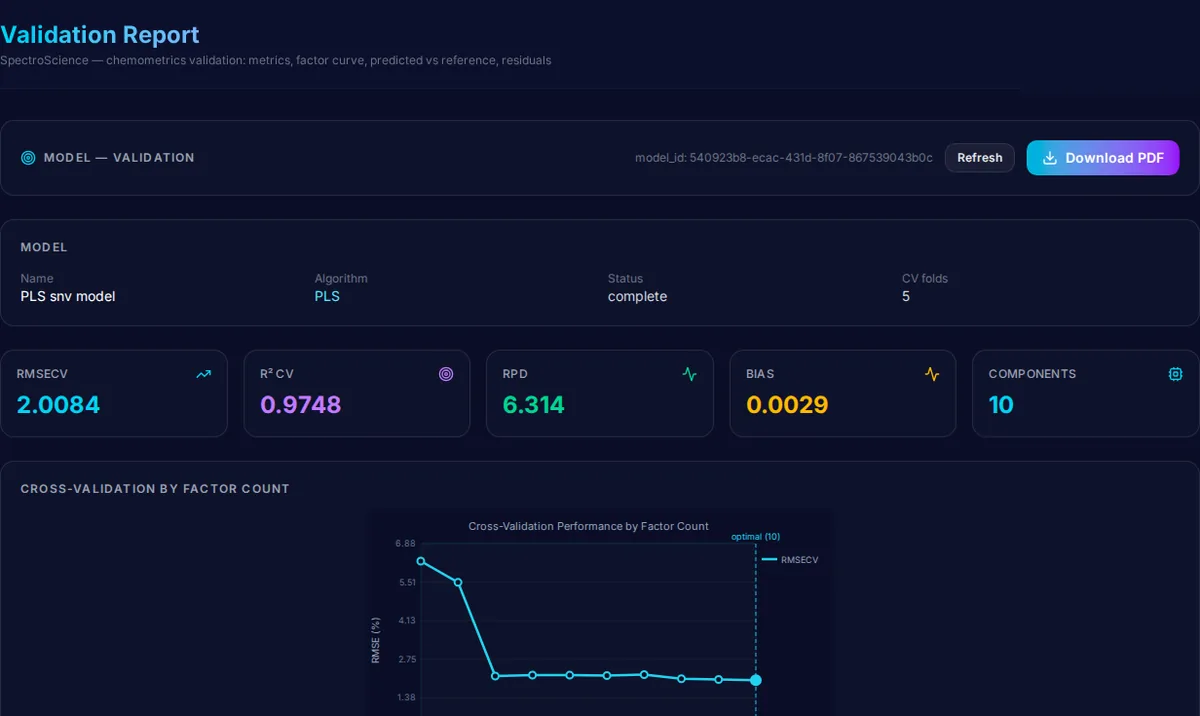
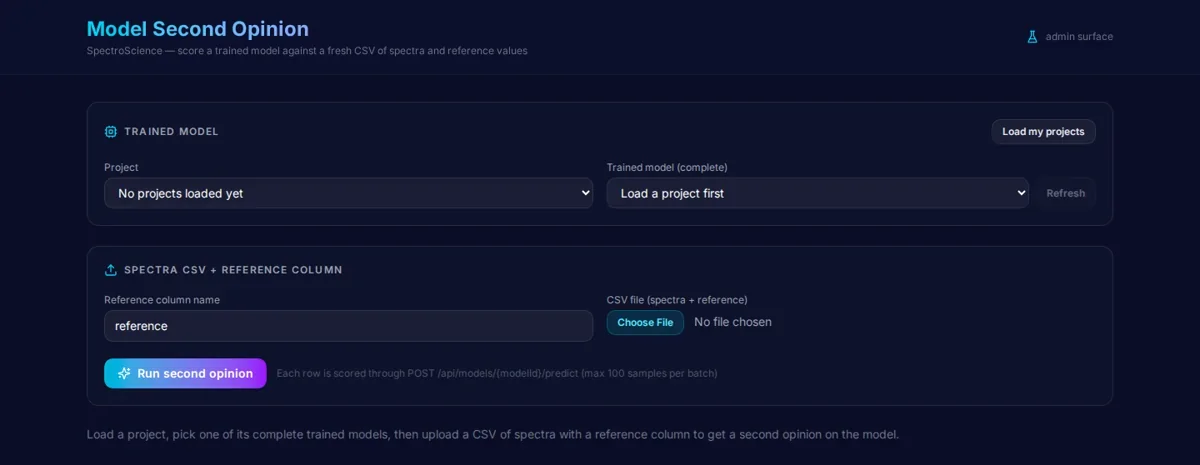
Problems Spectra Lab solves
These are the questions analysts and statisticians keep asking about calibration. Here is what the Lab does about each one today.
“Which preprocessing should I use?”
Compare methods side by side on your own spectra and see the error change; the demo shows SNV can destroy a signal.
“How many PLS components should I keep?”
The RMSECV-per-component curve and the chosen minimum, so over-fitting is visible.
“My RMSECV looks good, will it hold on new samples?”
RMSECV, R2 CV, RPD and bias side by side, plus Second Opinion on new spectra.
Coming next: a separate test-set partition by lot or date.“Is this sample an outlier or a real product?”
Hotelling T2 and Q residual flags per sample.
“The software is expensive or tied to one instrument.”
Runs in the browser on CSV from any instrument; no installation.
“It worked on one instrument and fails on another.”
The course lesson on calibration transfer is available today.
Coming next: calibration transfer (slope/bias and standardization).Based on recurring questions from analysts and statisticians in public Q&A forums and the calibration literature.
Free chemometrics resources on SpectroScience
Calculators
Model diagnostics, calibration method selector and feasibility checker
NIR Calibration and Chemometrics guide
NIR laboratory guide
NIR glossary
NIR vs wet chemistry
Practice quizzes
PDF: NIR cheat sheet
PDF: NIR glossary
PDF: NIR troubleshooting guide
What you can do with Spectra Lab chemometrics software
Import spectra (CSV)
Upload your spectral data as a CSV file with one row per sample, alongside the reference values you already measured with wet chemistry.
Preprocess (SNV, MSC, Savitzky-Golay, baseline)
Standard normal variate, multiplicative scatter correction, Savitzky-Golay smoothing and derivatives, and baseline correction — applied consistently to every spectrum.
Calibrate (PLS regression with cross-validation)
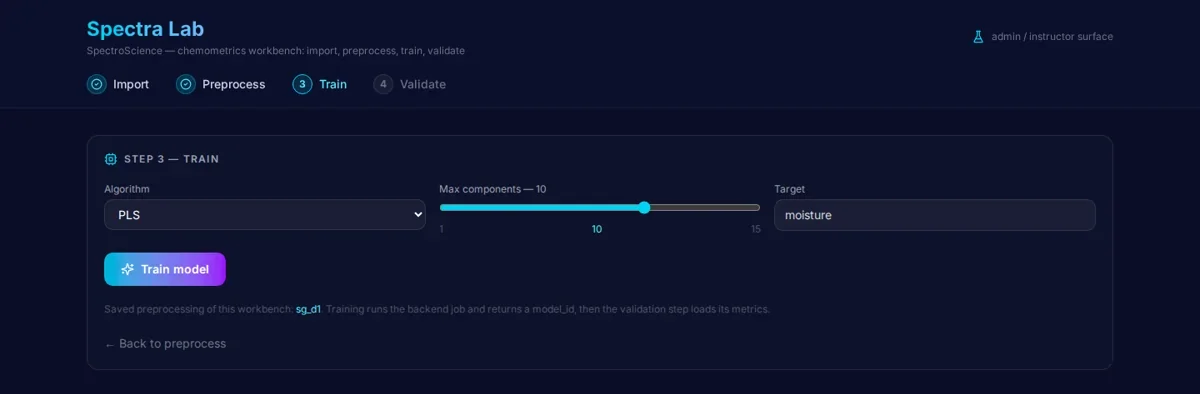
Build partial least squares regression models against your reference values, with cross-validation that keeps the component count honest.
Validate and second-opinion (RMSECV, RPD, bias, T2/Q outliers, PDF report)
Get RMSECV, RPD and bias in one view, inspect Hotelling T2 and Q residual outlier diagnostics, and export a PDF report you can file with the method.
From calibration curve to NIR calibration in near infrared spectroscopy
A single-wavelength calibration curve goes back to the Beer-Lambert law: absorbance is proportional to concentration, so one wavelength and a linear fit can quantify one analyte in a clean matrix. Real samples are not clean. Scattering, particle size, temperature and overlapping absorption bands break the single-wavelength assumption.
Multivariate calibration solves this by using hundreds of wavelengths at once and letting partial least squares regression find the combinations that carry the information and reject the rest. Spectra Lab walks that whole path for you: Beer-Lambert calculator, NIR calibration methods compared: MLR, PCR, PLS and ANN, and How to build a PLS model in practice: from raw spectra to validated calibration.
What is partial least squares regression? PLS vs principal component analysis (PCA), in plain words
PCA: what is in my spectra?
Principal component analysis is exploration. It finds the directions of largest variance in the spectral data and shows you whether your samples cluster, drift or split into groups. There is no reference value involved. Use it to understand your set, find outliers and see whether your calibration population is really one population.
How to run PCA on NIR spectra step by step · How to interpret a PCA score plot
PLS: what is in my spectra that predicts moisture?
Partial least squares regression is prediction with a purpose. It rotates the same kind of components, but it chooses them so that they also explain your reference values. That is why PLS regression usually beats PCA followed by regression when you actually want a number out of the instrument.
Model validation like a lab manager: RMSECV, RPD, bias and Hotelling T2
A calibration is only as good as its validation. Spectra Lab reports the numbers a lab manager asks for, and lets you pull them into a report you can defend in an audit.
- RMSECV
- Root mean square error of cross-validation: the error you should expect on new samples from the same population, computed by leaving samples out and predicting them back.
- RMSEP and bias
- When you have an independent test set you also get RMSEP, and the bias tells you whether the model is systematically high or low rather than just noisy.
- RPD thresholds
- RPD is the ratio of reference standard deviation to prediction error. As a rule of thumb, below about 2.5 a model is only good enough for screening, and above about 3 it can be considered for quantitative use.
- Hotelling T2 and Q outliers
- T2 flags samples that sit far from the calibration centre; Q residuals flag samples the model cannot reconstruct. Together they separate unusual samples from bad spectra.
Read more: Cross-validation in NIR calibration: leave-one-out vs k-fold · Choosing the right NIR calibration validation approach · How to detect NIR spectral outliers.
Learning path: the course lessons that teach each step
Spectra Lab is the practice bench for the NIR spectroscopy course. Each stage of the workflow maps to a lesson that explains the theory behind it.
- Import and clean spectra → course lessons
- Preprocessing and scatter correction → course lessons
- PCA and score plots → course lessons
- PLS regression and component choice → course lessons
- Validation, RMSECV, RPD and bias → course lessons
- Outliers, T2 and Q diagnostics → course lessons
New to NIR and chemometrics? Get learner access with the NIR course.
Frequently asked questions
What is partial least squares regression?
What is a Savitzky-Golay filter used for in spectroscopy?
Is Spectra Lab free?
Which instruments' spectra work with Spectra Lab?
What file format does Spectra Lab accept?
Is my data private?
PLS or PLS-DA?
How many samples do I need?
How many components should I use in a PLS regression?
What if RMSEP or RMSECV has no clear minimum?
Should I mean-center or autoscale spectra before PLS?
How much variance should PCA capture?
How do I know a new sample is within my calibration?
Can I cross-validate with replicate scans?
Open Spectra Lab and calibrate something real
Sign in to work with your own spectra, or join the learner path with the NIR course and learn the chemistry behind every button.